Read data, find averages and work out chance
Learn mean, median, mode and range, how to find a missing value and a weighted average, how to read bar graphs, circle graphs, dot plots, histograms, box plots and scatter plots, and how to find simple and compound probabilities and count outcomes. Includes eight original questions with worked answers.
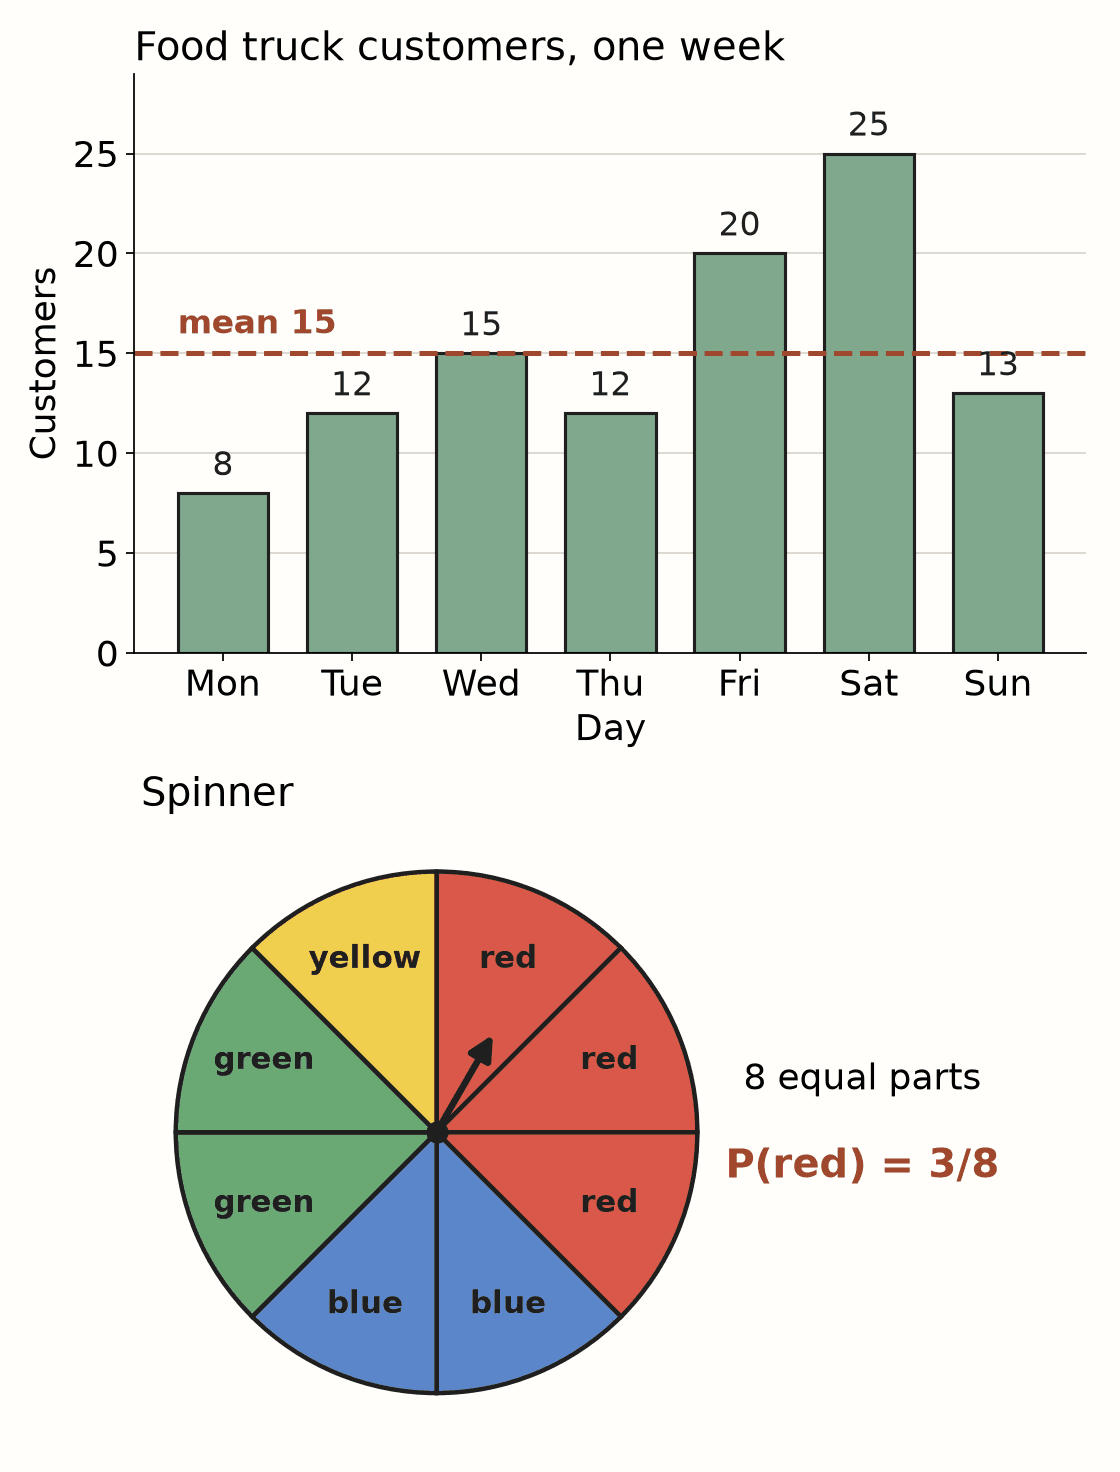
| Figure | Data | What it shows |
|---|---|---|
| Food truck bar graph | Mon to Sun: 8, 12, 15, 12, 20, 25, 13 customers | Mean 15, median 13, mode 12, range 17 |
| Spinner, 8 equal parts | 3 red, 2 blue, 2 green, 1 yellow | P(red) = 3/8; P(not red) = 5/8 |
Four numbers that describe a data set
The bar graph shows how many customers a food truck had each day for one week: 8, 12, 15, 12, 20, 25 and 13. Four numbers can sum up a list like this.
Mean (the average): add all the values and divide by how many there are. The total is 105 and there are 7 days, so the mean is 105 ÷ 7 = 15 customers.
Median (the middle): put the values in order first: 8, 12, 12, 13, 15, 20, 25. The middle one of 7 values is the 4th, so the median is 13. Mode (the most common): 12 appears twice, so the mode is 12. Range (the spread): largest minus smallest, 25 − 8 = 17.
The GED® formula sheet gives the meaning of mean and median, but not mode or range. Learn those two now: mode is the value that appears most often, and range is the biggest value minus the smallest.
Even counts and outliers
With an even number of values there are two middle numbers. The median is their mean. For 4, 7, 9 and 10, the middle two are 7 and 9, so the median is (7 + 9) ÷ 2 = 8.
An outlier is a value far from the rest. Five workers earn $30, $32, $35, $38 and $165 thousand a year. The mean is $300 thousand ÷ 5 = $60 thousand, which is more than four of the five earn. The median, $35 thousand, describes a typical worker better.
Rule of thumb: when one value is far from the others, the median is usually the better picture of a typical value. The mean is pulled toward the outlier.
Missing values, frequency tables and weighted averages
Missing value: work with the total. Four test scores have a mean of 85, so together they must add to 4 × 85 = 340. If three are 80, 90 and 82 (total 252), the fourth is 340 − 252 = 88.
Frequency table: a table can say how many times each value appears. Ten people were asked how many pets they have: 3 said 0, 5 said 1 and 2 said 2. The total number of pets is 3 × 0 + 5 × 1 + 2 × 2 = 9, so the mean is 9 ÷ 10 = 0.9 pets per person. Divide by the number of people (10), not the number of rows (3).
Weighted average: some parts count more than others. If homework is 40% of a grade with a score of 90 and tests are 60% with a score of 80, the grade is 0.40 × 90 + 0.60 × 80 = 36 + 48 = 84.
Reading charts and tables
Before you look at any numbers, read the title, the labels on each axis, the units and the scale. Check whether the scale starts at 0 and how much each grid line is worth. A key tells you what colors or symbols mean.
A bar graph compares groups. A circle graph shows parts of one whole; multiply the percent by the total to get a count. If 30% of a $2,400 budget goes to food, that is 0.30 × 2,400 = $720.
A dot plot puts one dot above a number line for each value. A histogram uses bars for ranges of values, such as ages 20–29, so you can see where most values fall but not each exact value. A box plot shows five numbers: the smallest value, the lower quartile, the median (the line inside the box), the upper quartile and the largest value. The box holds the middle half of the data.
A scatter plot shows pairs of values as points. If the points rise from left to right, the two things tend to increase together; if they fall, one tends to go down as the other goes up. A pattern does not prove that one thing causes the other.
Simple probability
Probability is how likely something is, from 0 (impossible) to 1 (certain). When all outcomes are equally likely: probability = number of outcomes you want ÷ total number of outcomes.
The spinner in the figure has 8 equal parts and 3 are red, so P(red) = 3/8. That is 0.375, or 37.5%. P(blue) = 2/8 = 1/4.
The chance that something does not happen is 1 minus the chance that it does. P(not red) = 1 − 3/8 = 5/8.
Theoretical probability comes from counting outcomes. Experimental probability comes from trying it. If 40 spins give 12 reds, the experimental probability is 12/40 = 0.3. To predict, multiply: in 200 spins, expect about 3/8 × 200 = 75 reds.
Compound probability: and, or
“And” for independent events: when one result does not change the other, multiply. Spin twice: P(red, then red) = 3/8 × 3/8 = 9/64. Flip a coin and roll a die: P(heads and a 6) = 1/2 × 1/6 = 1/12.
Without replacement: if you do not put an item back, the second probability changes. A bag holds 4 green and 6 white tiles. P(green, then green) = 4/10 × 3/9 = 12/90 = 2/15. After one green tile is gone, 3 green tiles are left out of 9.
“Or” when the events cannot both happen: add. On one spin, P(red or blue) = 3/8 + 2/8 = 5/8. If they can overlap, subtract the overlap once. On a die, P(even or greater than 4) = 3/6 + 2/6 − 1/6 = 4/6 = 2/3, because 6 is in both groups.
Counting outcomes
Multiplication rule: if you make one choice in a ways and another in b ways, there are a × b ways to do both. 3 shirts and 4 pairs of pants make 3 × 4 = 12 outfits. A 4-digit code using 0–9, with repeats allowed, has 10 × 10 × 10 × 10 = 10,000 possibilities.
Order matters (a permutation): 5 runners can finish first, second and third in 5 × 4 × 3 = 60 ways, because the first place can be any of 5, the second any of the 4 left, the third any of the 3 left.
Order does not matter (a combination): choosing 3 of the 5 runners for a team. Count the ordered picks (60), then divide by the number of ways to order one group of 3 (3 × 2 × 1 = 6): 60 ÷ 6 = 10 teams.
Ask first: does the order change the result? A prize list (first, second) is ordered; a team or a group of toppings is not.
Where this comes from
Where this comes from: GED Testing Service’s Assessment Guide for Educators: Mathematical Reasoning lists target Q.6, “interpret and create data displays” (bar graphs, circle graphs, dot plots, histograms, box plots, tables and scatter plots); target Q.7, “calculate and use mean, median, mode and weighted average,” including a missing data value and averages from frequency counts; and target Q.8, “utilize counting techniques and determine probabilities,” including combinations, permutations and simple and compound events. The guide places these in quantitative problem solving in measurement, about 20 percent of the GED® Mathematical Reasoning test. The GED Testing Service formula sheet defines mean and median. We checked both on October 20, 2026.
These sources set the topic. The explanations, figures, data and questions here are original FinishHigh practice, not GED® test questions. GED® is a registered trademark of the American Council on Education. FinishHigh is independent and not affiliated with or endorsed by it. This lesson teaches one starting skill. It is not a full course or an official readiness result.
Next, try the questions below. For each one, write down which kind it is first: an average, a chart, a chance, or a count.
Your turn.
Try each question before opening the explanation. These are FinishHigh practice examples, not GED® test questions.
Hours studied on six days: 3, 6, 2, 6, 8, 5. Find the mean, median, mode and range.
Show the answer and why
Mean: 30 ÷ 6 = 5 hours. Median: in order, 2, 3, 5, 6, 6, 8; the middle two are 5 and 6, so (5 + 6) ÷ 2 = 5.5 hours. Mode: 6 (it appears twice). Range: 8 − 2 = 6 hours.
The mean of five weekly paychecks is $420. Four of them are $400, $450, $380 and $430. What is the fifth?
Show the answer and why
$440. All five must total 5 × 420 = $2,100. The four add to $1,660. 2,100 − 1,660 = $440.
Quizzes count for 30% of a grade and the final counts for 70%. A student scores 70 on quizzes and 90 on the final. What is the grade?
Show the answer and why
84. Weighted average: 0.30 × 70 + 0.70 × 90 = 21 + 63 = 84. It is closer to 90 because the final counts more.
A survey of 20 households counted children: 4 households have 0, 7 have 1, 6 have 2 and 3 have 3. Find the mean and the median number of children.
Show the answer and why
Mean: total children = 4 × 0 + 7 × 1 + 6 × 2 + 3 × 3 = 0 + 7 + 12 + 9 = 28, and 28 ÷ 20 = 1.4. Median: with 20 values, find the 10th and 11th in order. Values 1–4 are 0 and values 5–11 are 1, so both are 1 and the median is 1.
A circle graph shows how 400 people get to work: car 45%, bus 35%, walk 12%, bike 8%. How many take the bus, and how many more drive than take the bus?
Show the answer and why
Bus: 0.35 × 400 = 140 people. Car: 0.45 × 400 = 180 people. 180 − 140 = 40 more people drive. A shortcut: 45% − 35% = 10%, and 10% of 400 is 40.
Use the spinner in the figure (3 red, 2 blue, 2 green, 1 yellow). What is P(green)? What is P(not yellow)?
Show the answer and why
P(green) = 2/8 = 1/4, or 25%. P(not yellow) = 1 − 1/8 = 7/8, or 87.5%. You can also count: 7 of the 8 parts are not yellow.
A bag has 5 red and 3 blue marbles. You draw one, put it back, and draw again. What is P(blue, then blue)? What if you do not put it back?
Show the answer and why
With replacement: 3/8 × 3/8 = 9/64. Without replacement: 3/8 × 2/7 = 6/56 = 3/28, because after one blue marble is gone, 2 blue are left out of 7.
A sandwich shop offers 3 breads, 5 fillings and 2 sauces. How many sandwiches use one of each? Then: how many ways can you choose 2 different toppings from 4 if order does not matter?
Show the answer and why
Sandwiches: 3 × 5 × 2 = 30. Toppings: ordered picks are 4 × 3 = 12; each pair was counted twice (AB and BA), so 12 ÷ 2 = 6 pairs.
Trusted sources and further study
Sources guide the topics and factual information. The lesson wording, examples, and questions are original FinishHigh material.
- Official math formula sheet ↗GED Testing Service · checked 2026-10-07
- Math: official assessment targets for educators ↗GED Testing Service · checked 2026-10-21
Another small step
Independent practice, not the GED® test or a pass guarantee. Aid and admission depend on the provider’s rules.
Choose your next free lesson ↗