Functions: tables, graphs and f(x)
Decide if a table or graph is a function, find f(x) for a number, read intercepts, highs and lows from a graph, and compare two functions shown in different ways. Includes seven original questions with worked answers.
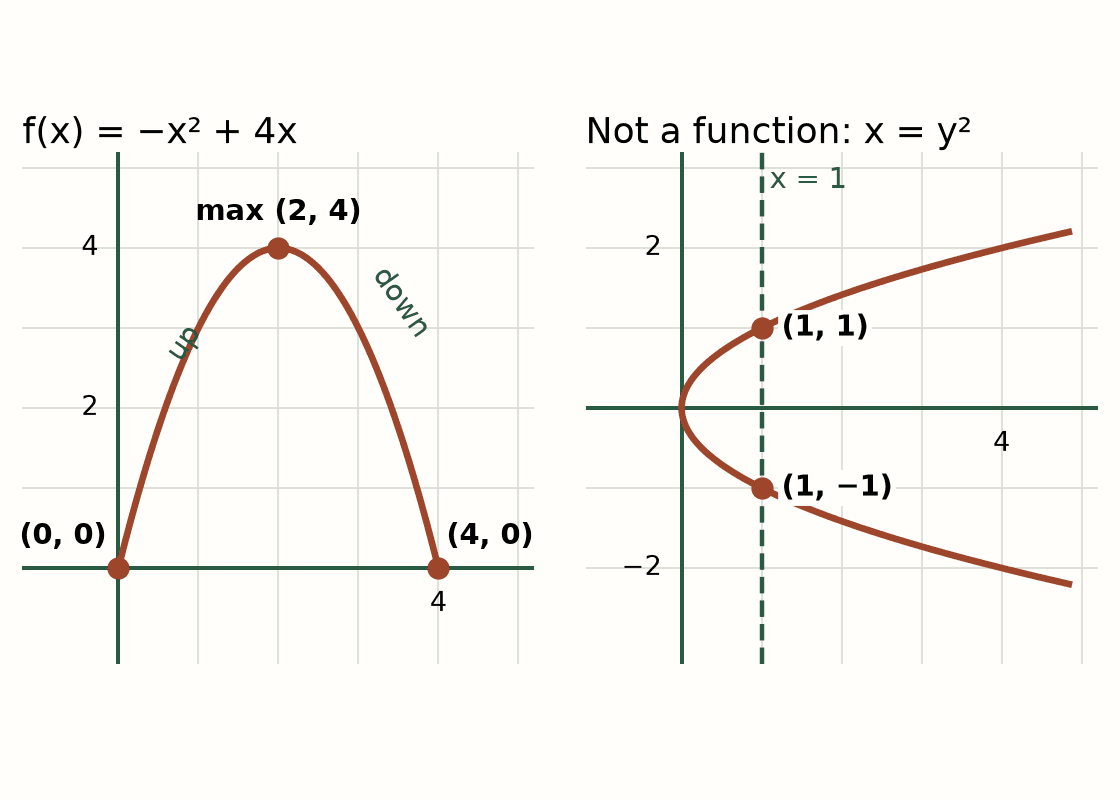
| Feature | What to look for | Answer |
|---|---|---|
| Left: x-intercepts | Where the graph crosses the x-axis (y = 0) | (0, 0) and (4, 0) |
| Left: y-intercept | Where the graph crosses the y-axis (x = 0) | (0, 0) |
| Left: maximum | The highest point | (2, 4) |
| Left: increasing and decreasing | Read from left to right: going up or going down | Up from x = 0 to x = 2; down from x = 2 to x = 4 |
| Right: vertical line test | Does any up-and-down line cross the graph twice? | Yes. x = 1 crosses at (1, 1) and (1, −1), so it is not a function |
A function gives one output for each input
A function is a rule that takes an input and gives back exactly one output. Think of a vending machine: press B4 and you should get the same snack every time. If B4 sometimes gave chips and sometimes gave candy, the machine would not be a function.
In a table, the inputs are usually x and the outputs are y. Check each input. If any input shows up with two different outputs, the table is not a function. For example, if x = 2 is paired with 5 in one row and with 7 in another, it is not a function.
It is fine for two different inputs to share an output. In a table where x = 1 gives 6 and x = 3 also gives 6, each input still has only one output, so it is a function.
Check a graph with the vertical line test
On a graph, each point is (input, output). Picture moving a straight up-and-down line across the graph from left to right. If the line ever touches the graph in two or more places at once, one input has two outputs, so the graph is not a function. If it never touches more than once, the graph is a function.
In the right-hand diagram, the dashed line at x = 1 crosses the sideways curve at (1, 1) and (1, −1). That one input has two outputs, so the curve fails the test. Every straight line that is not vertical passes the test, and so does the hill shape on the left.
Read function notation f(x)
Functions are often named with letters such as f, g or h. The notation f(x) is read “f of x.” It means “the output of f when the input is x.” It does not mean f times x.
If f(x) = 3x + 2, then f(4) means “put 4 in for x.” So f(4) = 3(4) + 2 = 12 + 2 = 14. The point (4, 14) is on the graph of f. Writing f(4) = 14 is a short way to say “when the input is 4, the output is 14.”
The same steps work for a squared term. If g(x) = x² − 5x + 6, then g(−2) = (−2)² − 5(−2) + 6 = 4 + 10 + 6 = 20. Put a negative input in parentheses before you square it: (−2)² is 4, not −4. On the test’s calculator, type the parentheses, too.
Read the key features of a graph
Graphs answer real questions. Look at the left-hand diagram, f(x) = −x² + 4x. Imagine x is the time in seconds after a ball is tossed and f(x) is its height in meters.
The x-intercepts are where the graph crosses the x-axis, where the output is 0. Here they are (0, 0) and (4, 0): the ball leaves the ground at 0 seconds and lands at 4 seconds. The y-intercept is where the graph crosses the y-axis, where the input is 0. Here it is (0, 0).
Read a graph from left to right. It is increasing where it goes up and decreasing where it goes down. This graph increases from x = 0 to x = 2 and decreases from x = 2 to x = 4. The highest point is the maximum, (2, 4): the ball is highest, 4 meters, after 2 seconds. A lowest point is called a minimum. The function is positive where the graph is above the x-axis, here between x = 0 and x = 4.
Compare two functions shown different ways
A test question may show one function as a table and another as an equation, graph or sentence. To compare them, find the same feature in each one. The most common feature is the rate of change, which is the slope for a straight line.
Example: Phone Plan A is shown in a table: 1 month costs $45, 2 months cost $70, and 3 months cost $95. Plan B is written as B(m) = 30m + 10, where m is months. Plan A goes up $25 each month. Plan B goes up $30 each month, the number in front of m. So Plan B has the greater rate of change. To compare total cost, use the same input. After 4 months, Plan A costs $95 + $25 = $120 and Plan B costs 30(4) + 10 = $130.
For proportional relationships, compare the unit rates. Walker A’s distance is d = 3.5t miles after t hours. Walker B’s table shows 8 miles after 2 hours and 12 miles after 3 hours, which is 4 miles per hour. Walker B is faster, because 4 is more than 3.5.
Where this comes from
Where this comes from: GED Testing Service’s Assessment Guide for Educators: Mathematical Reasoning lists assessment target A.7, “compare, represent, and evaluate functions.” This lesson covers comparing two proportional relationships shown in different ways (A.7.a), deciding whether a table or graph is a function (A.7.b), evaluating linear and quadratic functions written in function notation (A.7.c), and comparing two functions shown in different ways (A.7.d). It also covers reading key features of a graph, such as intercepts, where it increases or decreases, and maximums and minimums (indicator A.5.e). The guide places graphs and functions at about 25 percent of the GED® Mathematical Reasoning test, within the algebraic half of about 55 percent. We checked the guide on October 20, 2026.
These sources set the topic. The explanations, diagrams and questions here are original FinishHigh practice, not GED® test questions. GED® is a registered trademark of the American Council on Education. FinishHigh is independent and not affiliated with or endorsed by it. This lesson teaches one starting skill. It is not a full course or an official readiness result.
Next, try the questions below. If slope still feels new, review the lesson “Points, slope and lines on the coordinate plane” first. Write down one mistake you fixed so you can check it again tomorrow.
Your turn.
Try each question before opening the explanation. These are FinishHigh practice examples, not GED® test questions.
A table pairs x = 1, 2, 3, 2 with y = 4, 6, 8, 9. Is this a function? Explain.
Show the answer and why
No. The input 2 appears twice, once with output 6 and once with output 9. A function must give exactly one output for each input.
A table pairs x = −1, 0, 1, 2 with y = 3, 3, 3, 3. Is this a function? Explain.
Show the answer and why
Yes. Each input appears only once and has one output. It is fine that every output is 3; different inputs may share the same output. Its graph is a flat line.
If f(x) = 5x − 7, find f(3) and f(−2).
Show the answer and why
f(3) = 8 and f(−2) = −17. For f(3): 5(3) − 7 = 15 − 7 = 8. For f(−2): 5(−2) − 7 = −10 − 7 = −17.
If g(x) = x² − 3x, find g(4) and g(−1).
Show the answer and why
Both equal 4. g(4) = 4² − 3(4) = 16 − 12 = 4. g(−1) = (−1)² − 3(−1) = 1 + 3 = 4. Two inputs can share an output.
Use the left-hand diagram of f(x) = −x² + 4x. What is the maximum, and over which x-values is the graph increasing?
Show the answer and why
The maximum is the point (2, 4), so the greatest output is 4 and it happens at x = 2. The graph increases from x = 0 to x = 2, then decreases from x = 2 to x = 4. Check: f(2) = −(2²) + 4(2) = −4 + 8 = 4.
Function A is shown in a table: x = 0, 1, 2, 3 gives y = 5, 9, 13, 17. Function B is y = 3x + 8. Which has the greater rate of change? Which has the greater y-intercept?
Show the answer and why
A has the greater rate of change: its outputs go up by 4 each time x goes up by 1, and 4 is more than B’s 3. B has the greater y-intercept: 8, compared with A’s 5 (the output when x = 0).
Printer A’s graph is a straight line through (0, 0) and (3, 90), where x is minutes and y is pages. Printer B prints p = 32m pages in m minutes. Which printer is faster, and by how much?
Show the answer and why
Printer B is faster by 2 pages per minute. Printer A prints 90 ÷ 3 = 30 pages per minute. Printer B prints 32 pages per minute, the number in front of m. 32 − 30 = 2.
Trusted sources and further study
Sources guide the topics and factual information. The lesson wording, examples, and questions are original FinishHigh material.
- Math: GED® test topic guidance ↗GED Testing Service · checked 2026-10-14
- Math: official assessment targets for educators ↗GED Testing Service · checked 2026-10-21
Another small step
Independent practice, not the GED® test or a pass guarantee. Aid and admission depend on the provider’s rules.
Choose your next free lesson ↗