Points, slope and lines on the coordinate plane
Plot points in all four quadrants, find slope from a graph, a table or two points, write y = mx + b, and spot parallel and perpendicular lines. Includes eight original questions with worked answers.
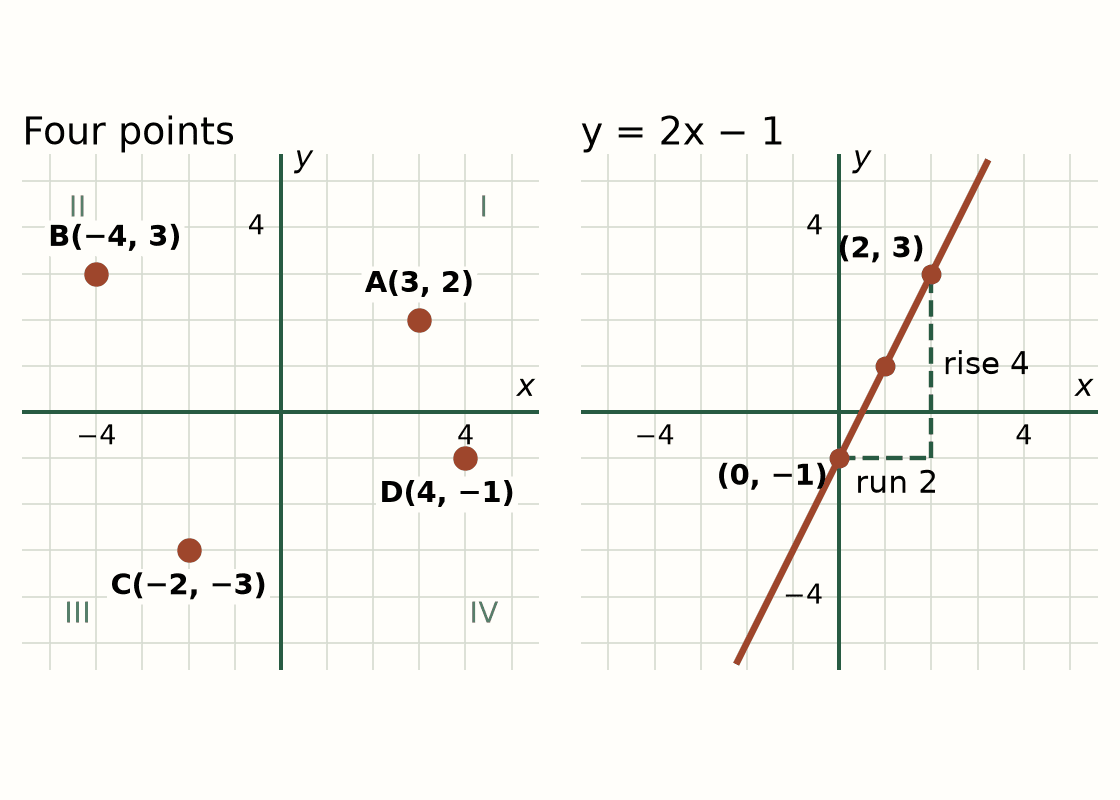
| Mark | Location | How to read it |
|---|---|---|
| Point A | (3, 2), Quadrant I | From the origin, right 3, then up 2 |
| Point B | (−4, 3), Quadrant II | Left 4, then up 3 |
| Point C | (−2, −3), Quadrant III | Left 2, then down 3 |
| Point D | (4, −1), Quadrant IV | Right 4, then down 1 |
| Line y = 2x − 1 | Crosses the y-axis at (0, −1); passes through (1, 1) and (2, 3) | From (0, −1) to (2, 3): run 2, rise 4, so slope = 4 ÷ 2 = 2 |
Find your way on the grid
A coordinate plane is a grid made by two number lines. The flat one is the x-axis. The up-and-down one is the y-axis. They cross at the origin, the point (0, 0).
Every point has an address called an ordered pair, written (x, y). The first number tells you how far to move left or right. The second number tells you how far to move up or down. To plot A at (3, 2), start at the origin, move right 3, then up 2. Negative x means move left, and negative y means move down. To plot C at (−2, −3), move left 2, then down 3.
The axes split the grid into four quadrants. They are numbered I, II, III and IV, going counterclockwise from the upper right. In Quadrant I both numbers are positive. In II, x is negative and y is positive. In III both are negative. In IV, x is positive and y is negative. A point that sits on an axis, such as (0, 4) or (−2, 0), is not in any quadrant.
Slope means rise over run
Slope tells you how steep a line is and which way it goes. Pick two points on the line. The rise is how much y changes. The run is how much x changes. Slope = rise ÷ run. As a formula, m = (y₂ − y₁) ÷ (x₂ − x₁). The letter m stands for slope.
Example: the line in the right-hand diagram passes through (0, −1) and (2, 3). The rise is 3 − (−1) = 4. The run is 2 − 0 = 2. The slope is 4 ÷ 2 = 2. That means every time you move 1 to the right, the line goes up 2.
Subtract in the same order on the top and the bottom. If you start with the second point's y, also start with the second point's x. Read lines from left to right, the way you read words. A positive slope goes up. A negative slope goes down. A flat line has slope 0. A straight up-and-down line has no slope at all; we say its slope is undefined, because the run is 0 and you cannot divide by 0.
Slope in a table is a rate
A table can show a line, too. Look at how much the output changes when the input changes. Say a worker earns $36 for 2 hours, $54 for 3 hours and $90 for 5 hours. From 2 to 3 hours the pay goes up $18. From 3 to 5 hours it goes up $36 over 2 hours, which is also $18 an hour. The slope is 18, and it means $18 per hour.
In real life, slope is a unit rate: dollars per hour, miles per gallon, liters per minute. When the line goes through (0, 0), as it does here (0 hours, $0), the relationship is proportional. Then you can also find the rate by dividing any output by its input: $54 ÷ 3 = $18.
Write the equation y = mx + b
Many lines can be written as y = mx + b. The m is the slope. The b is the y-intercept, the y-value where the line crosses the y-axis (where x = 0). In y = 2x − 1, the slope is 2 and the line crosses the y-axis at −1.
From a slope and one point: a line has slope 3 and passes through (2, 5). Put those numbers into y = mx + b: 5 = 3(2) + b, so 5 = 6 + b and b = −1. The equation is y = 3x − 1. Check: 3(2) − 1 = 5. It works.
From two points: a line passes through (1, 4) and (3, 10). First find the slope: (10 − 4) ÷ (3 − 1) = 6 ÷ 2 = 3. Then use one point: 4 = 3(1) + b, so b = 1. The equation is y = 3x + 1. Check the other point: 3(3) + 1 = 10. It works. Another form, y − y₁ = m(x − x₁), gives the same line; use whichever you find easier.
Graph a line from its equation
To graph y = 2x − 1, start at the y-intercept, (0, −1). Think of the slope 2 as 2/1: rise 2, run 1. From (0, −1), move right 1 and up 2 to reach (1, 1). Do it again to reach (2, 3). Draw a straight line through the points.
For a negative slope, move down instead of up. For y = −(2/3)x + 4, start at (0, 4). Move right 3 and down 2 to reach (3, 2). You can always check a point by putting its x into the equation: −(2/3)(3) + 4 = −2 + 4 = 2. It matches.
Parallel and perpendicular lines
Parallel lines never meet, so they rise at the same rate. They have the same slope but different y-intercepts. The lines y = 2x − 1 and y = 2x + 4 are parallel.
Perpendicular lines cross to make a square corner (a right angle). Their slopes are opposite reciprocals: flip the fraction and change the sign. The opposite reciprocal of 2 is −1/2, and the opposite reciprocal of −3/4 is 4/3. A quick test: multiply the two slopes. If the product is −1, the lines are perpendicular. For 2 and −1/2, 2 × (−1/2) = −1.
Example: find the line through (0, 6) that is parallel to y = 2x − 1. It needs the same slope, 2, and it crosses the y-axis at 6, so it is y = 2x + 6.
Where this comes from
Where this comes from: GED Testing Service’s Assessment Guide for Educators: Mathematical Reasoning lists assessment target A.5, “connect and interpret graphs and functions,” and target A.6, “connect coordinates, lines, and equations.” This lesson covers locating points (A.5.a), finding slope from a graph, equation or table (A.5.b), reading a unit rate as slope (A.5.c), graphing two-variable linear equations (A.5.d), writing a line’s equation from a slope and a point or from two points (A.6.a–b), and using slope to tell parallel from perpendicular lines (A.6.c). The guide places graphs and functions at about 25 percent of the GED® Mathematical Reasoning test, within the algebraic half of about 55 percent. The guide’s formula sheet lists the slope formula, y = mx + b and the point-slope form, so you do not need to memorize them. We checked the guide on October 20, 2026.
These sources set the topic. The explanations, diagrams and questions here are original FinishHigh practice, not GED® test questions. GED® is a registered trademark of the American Council on Education. FinishHigh is independent and not affiliated with or endorsed by it. This lesson teaches one starting skill. It is not a full course or an official readiness result.
Next, try the questions below. If negative numbers feel shaky, review subtracting a negative first: 3 − (−1) is the same as 3 + 1. Write down one mistake you fixed so you can check it again tomorrow.
Your turn.
Try each question before opening the explanation. These are FinishHigh practice examples, not GED® test questions.
Which quadrant is the point (−5, 2) in? Describe how to plot it.
Show the answer and why
Quadrant II. Start at the origin, move left 5 (x is negative), then up 2 (y is positive). Negative x with positive y is always Quadrant II, the upper left.
Find the slope of the line through (1, 2) and (4, 11).
Show the answer and why
The slope is 3. Rise: 11 − 2 = 9. Run: 4 − 1 = 3. Slope = 9 ÷ 3 = 3. The line goes up 3 for every 1 step to the right.
Find the slope of the line through (−2, 5) and (2, −3). Does the line go up or down from left to right?
Show the answer and why
The slope is −2, so the line goes down. Rise: −3 − 5 = −8. Run: 2 − (−2) = 4. Slope = −8 ÷ 4 = −2.
A water tank fills at a steady rate. After 2 minutes it holds 30 liters, after 4 minutes 60 liters, and after 6 minutes 90 liters. What is the slope, and what does it mean?
Show the answer and why
The slope is 15, which means 15 liters per minute. Each 2 more minutes adds 30 liters, and 30 ÷ 2 = 15. The tank started empty (0 liters at 0 minutes), so this is a proportional relationship: 30 ÷ 2, 60 ÷ 4 and 90 ÷ 6 all equal 15.
Write the equation of the line with slope −4 that passes through (1, 3).
Show the answer and why
y = −4x + 7. Put the numbers into y = mx + b: 3 = −4(1) + b, so 3 = −4 + b and b = 7. Check: −4(1) + 7 = 3. It works.
Write the equation of the line through (2, 1) and (6, 9).
Show the answer and why
y = 2x − 3. Slope: (9 − 1) ÷ (6 − 2) = 8 ÷ 4 = 2. Use (2, 1): 1 = 2(2) + b, so b = −3. Check the other point: 2(6) − 3 = 9. It works.
Explain how to graph y = −(1/3)x + 2 without making a table.
Show the answer and why
Start at the y-intercept, (0, 2). The slope −1/3 means down 1 for every 3 to the right. From (0, 2) move right 3 and down 1 to reach (3, 1). Do it again to reach (6, 0). Draw a straight line through the points. Check: −(1/3)(6) + 2 = 0.
Line P is y = 4x − 2. Line Q is y = −(1/4)x + 5. Line R is y = 4x + 7. Which lines are parallel, and which are perpendicular?
Show the answer and why
P and R are parallel: both have slope 4 and different y-intercepts. Q is perpendicular to both of them, because 4 × (−1/4) = −1.
Trusted sources and further study
Sources guide the topics and factual information. The lesson wording, examples, and questions are original FinishHigh material.
- Math: GED® test topic guidance ↗GED Testing Service · checked 2026-10-14
- Math: official assessment targets for educators ↗GED Testing Service · checked 2026-10-21
Another small step
Independent practice, not the GED® test or a pass guarantee. Aid and admission depend on the provider’s rules.
Choose your next free lesson ↗