Read graph axes and units before the numbers
Read a labeled graph, check its scale, and describe a change with the right units. Includes six original questions and worked answers.
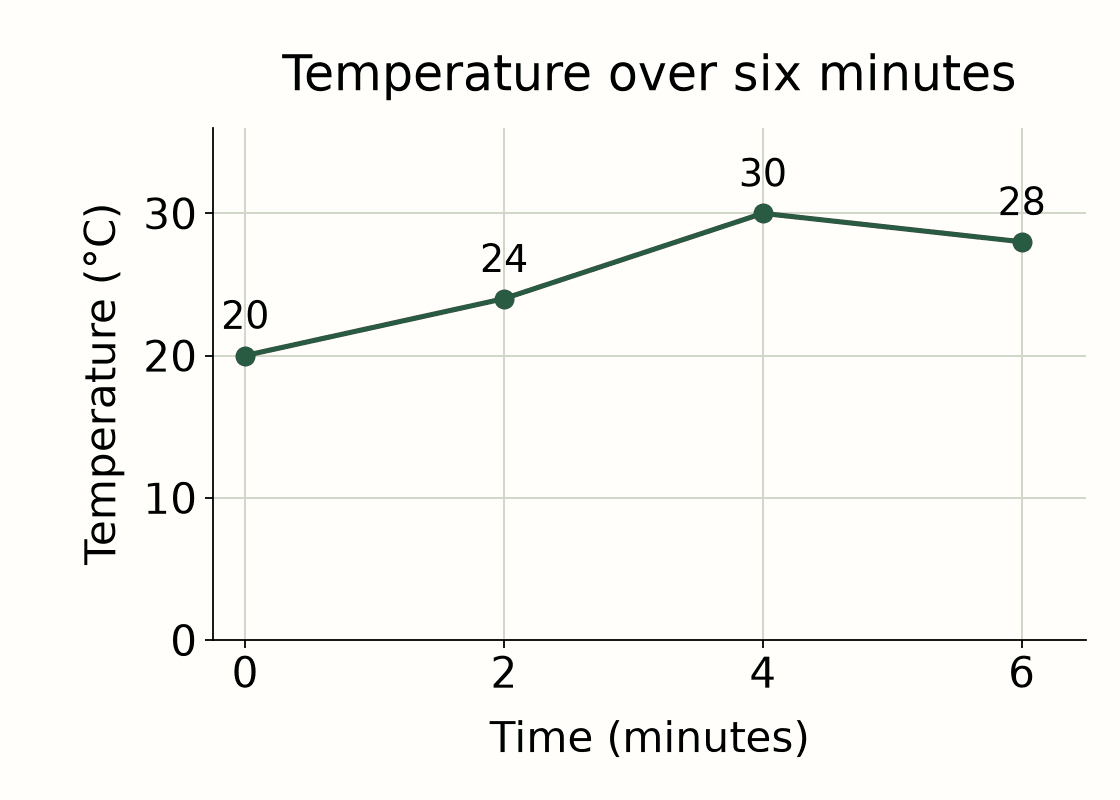
| Time (minutes) | Temperature (°C) |
|---|---|
| 0 | 20 |
| 2 | 24 |
| 4 | 30 |
| 6 | 28 |
First, name what each axis measures
An axis is a numbered line along the edge of a graph. In this graph, the horizontal axis (x-axis) shows time in minutes. The vertical axis (y-axis) shows temperature in degrees Celsius, written °C. Other graphs can use different labels, so read each one.
Start with the title, then read both labels and units. Minutes are not seconds. A temperature is not a count of people. These small checks help you avoid solving the wrong problem.
Read the scale, not just the number of spaces
The scale tells you how much each step represents. Here, the horizontal labels are 0, 2, 4, and 6: each labeled step is 2 minutes. The vertical labels are 0, 10, 20, and 30: each labeled step is 10 °C. The two axes do not have to use the same steps.
Halfway between 20 and 30 on this evenly spaced vertical scale is 25 °C. Calculate 20 + (30 − 20) ÷ 2 = 25. Do not call one grid space one degree unless the labels say so. Some graphs start above zero, skip values, or use a different kind of scale; check before comparing heights.
Read one point in two small moves
To find the reading at 4 minutes, locate 4 on the horizontal axis, move up to its dot, then move across to the vertical scale. The temperature is 30 °C. The table above gives the same four readings in text.
The point (4, 30) means 4 minutes and 30 °C in this graph. Writing 30 minutes or 4 °C reverses the labels. A dot and the origin are different: time zero has a temperature of 20 °C here, not zero.
Describe a change and keep its units
From 2 to 4 minutes, the temperature rises from 24 to 30 °C. The change is 30 − 24 = 6 °C over 4 − 2 = 2 minutes. If asked for an average rate of change, divide: 6 ÷ 2 = 3 °C per minute for that interval. That average does not prove a steady rise at every moment.
From 4 to 6 minutes, the change is 28 − 30 = −2 °C. Say that the temperature fell by 2 °C. A change in temperature is different from the final temperature, which is 28 °C.
Say what the graph can support
There is no recorded reading at 8 minutes. Extending the line would be a prediction, not another measurement. The four readings alone also do not explain why the temperature changed.
Use this routine for science and social studies: title → axis labels → units → scale → requested point or interval → answer with units. For a chart about people or money, also check the date range and whether the values are counts, percentages, dollars, or thousands of dollars.
GED® test topic guidance includes reading graphs and interpreting information. This short original lesson practices that skill; it is not a complete test guide or an official readiness score. For another science step, try the experiment lesson linked below.
Your turn.
Try each question before opening the explanation. These are FinishHigh practice examples, not GED® test questions.
What does each axis measure in this graph? Include the units.
Show the answer and why
The horizontal axis measures time in minutes. The vertical axis measures temperature in degrees Celsius (°C). Read the labels before interpreting a dot.
What value is halfway between the vertical labels 20 and 30?
Show the answer and why
25 °C. Each labeled vertical step is 10 °C, so half a step is 5 °C: 20 + 5 = 25. This is a scale value, not a new measured reading.
What is the temperature at 4 minutes?
Show the answer and why
30 °C. Start at 4 minutes on the horizontal axis, move to the dot, then read 30 on the vertical axis. The table confirms the reading.
From 2 to 4 minutes, what is the temperature change and the average rate of change?
Show the answer and why
It rises by 6 °C: 30 − 24 = 6. The interval is 2 minutes: 4 − 2 = 2. The average rate is 6 ÷ 2 = 3 °C per minute. A change (°C) and a rate (°C per minute) have different units.
From 4 to 6 minutes, did the temperature rise or fall, and by how much?
Show the answer and why
It fell by 2 °C. Calculate final minus initial: 28 − 30 = −2 °C. The minus sign describes a decrease; the final temperature is 28 °C.
Can you report a measured temperature at 8 minutes or prove why the temperature changed?
Show the answer and why
No. The recorded times stop at 6 minutes, and no cause is described. A prediction beyond the readings would need assumptions; explaining a cause would need more evidence.
Trusted sources and further study
Sources guide the topics and factual information. The lesson wording, examples, and questions are original FinishHigh material.
- Science: GED® test topic guidance ↗GED Testing Service · checked 2026-10-09
- Social studies: GED® test topic guidance ↗GED Testing Service · checked 2026-10-09
- OpenStax: read a coordinate system ↗OpenStax, Rice University · checked 2026-10-09
- BLS: label a graph and check its scale ↗U.S. Bureau of Labor Statistics · checked 2026-10-09
Another small step
Independent practice, not the GED® test or a pass guarantee. Aid and admission depend on the provider’s rules.
Choose your next free lesson ↗